Monday, September 17, 2012

Experiment 6: speed of sound

Purpose:
The purpose of this experiment is to measure the speed of sound air by analyzing the sound going back and forth through the closed tube in one end. Students will compare the experimental value to the theoretical value to analysis the error in the experiment.

Procedure:
1. Set up the microphone to the sensor and computer.
2. Measure the length and diameter of the tube.
L = 103.5 ± 0.25 cm, d = 11.55 ± 0.025 cm

3. Set up the microphone and the tube as shown.
Making a snap sound into the tube and collect data. Try until get a wave pattern which clearly shows the initial and reflected waves.
Measure the time interval between the initial and reflected waves. T= 0.00738 - 0.00086 = 0.00652 s

Calculate the speed of sound wave in air
v = 2L/T = 2(1.035)/0.00652 = 317.5 m/s

It is important for the sound we use as brief as possible because the speed of sound is about 300m/s, and the length of the tube is only 1 meter. The time for the sound going back and forth is less than 0.1s. Therefore, the brief time can make us not collect the back and forth of many times.

Calculate the speed of sound in air at room temperature (assuming that room temperature is 20 C)
 v = 331+0.60T = 331 +0.60(20) = 343 m/s
These values do not agree.

%error = (Measure - Actual)/(Measure + Actual)/2 = (317.5 - 343)/(317.5 + 343)/2 = 7.7%

The reasons which make inaccuracies in the measurement are the uncertainty of the meter stick when we measure the length, the error of the microphone when it receives the sound and transfer to the softwave to graph. The softwave actually does not read the actual sound wave; it reads the square function of the sound wave. In addition, the error when we get the time from the graph. We could not know the accurate time when we snap the finger and the time when the sound coming back. We just assume the two highest points are when the sound going back and forth. If these errors are concerned, 7.7% error is reasonable.

Summary:
Based on the purpose of this experiment, the speed of sound is measured by experiment and calculated by theoretical. The % error between those two values is reasonable if the uncertainties and errors of the measurements are concerned. The experiment is successfully shown the speed of sound in air is around 340m/s and depends on the temperature of the surrounding.


Experiment 5: Introduction to sound

Purpose:
The purpose of  this experiment is to examine the sound. In this experiment, students will use the sensor to collect the sound data to computer and get the graph of the sound. As soon as students get the graph, students will examine the sound and see if the sound wave have the same characteristics as mechanical wave.
Procedure:


1. Set up the sensor to the computer and the microphone to the sensor.
2. One person in our group say "AAAAAAA" into the microphone and hit Collect.
3. Once we get the graph, we start examining the graph.
The graph is a periodic wave because it has the shape similar to periodic waves which has the period, the amplitude, the wavelength.


 There is only one wave shown in this sample. We determined this number by looking at the maximum amplitude of the sound. The little patterns between two bigger amplitude is the surrounding noise.

  For something in our everyday experience such as "Lunch passes by at a snails pace" or "Physics class flies by as fast as a jet by the window", the probe collected data for about 0.04 - 0.05 second.

The period of the wave is T = 0.0209 - 0.0056 = 0.0153 s. We measure the time between 2 maximum amplitude to calculate the period.

The frequency is f = 1/T = 1/ 0.0153 = 65.36 Hz. The frequency is equal to inverse of the period.

The wavelength λ = v/f = 340 / 65.36 = 5.202 m. This length is almost as long as the white board.

The amplitude A = (3.261 - 2.413)/2 = 0.424. This number is determined by taking the average of the maximum and minimum amplitudes.

The graph would be seen bigger especially the little waves between the 2 big amplitudes.  Those waves will look like the waves itself. The period would be smaller, so the frequency is higher. The wavelength will become the distance between 2 little amplitudes, so the wavelength is smaller. Also, the amplitude is smaller.


4. Now someone else in the group says "AAAAAA" and collect data.
The 2 patterns are very similar except the amplitude.These two graphs show 4 antinodes in each. As shown, they have very close the number of waves. The period is T = 0,0179 - 0.0044 = 0.0135. The frequency is f = 1/T = 1/0.0135 = 74.07 Hz.  Wavelength  λ = v/f = 340/74.07 = 4.59 m. Those values are closed to the first person values .The reason is the two persons did the experiment are male which have similar frequency when they speak. However, the amplitude can be seen bigger than the first person. The reason is the second person says "AAAAA" louder than the first person.

5. Now, collect the sound made by the tuning fork.


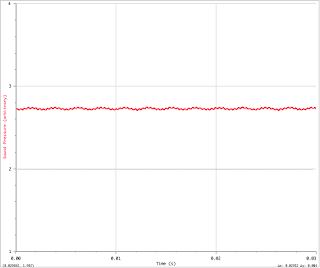
The sound waves made by the tuning fork is much smother than the sound waves made by human. We can see that the pattern is similar to the sinusoidal waves. The reason which two the waves made by human and the waves made by the tuning fork is different is human cannot keep the same frequency when we say "AAAAA" into the microphone. In addition, the tuning fork vibrates at the same frequency when striking on a soft object.

6. Now strike the tuning fork to a soft object but not as hard as the previous one and collect data.

I expect to see the amplitude is smaller because the sound made by soft strike is less loud than the previous one. Also, the wavelength is smaller because when we strike softer, the force exerts on the tuning force is smaller. As the result, the tuning fork will vibrate less than the previous one.


 I strike the tuning fork softer than the previous one to make the sound softer.
 The graph shows what I expected is correct. The new waves have smaller amplitude and wavelength.


Summary.
Based on the purpose of this experiment, the sound can be treated similar to the mechanical waves on string or the wave visible waves such as the water waves. If the sound is made by the smooth frequency, the sound waves look like the sinusoidal waves. Moreover, for the same making sound equipment, the sound is proportional to the graph of the sound.


Monday, September 10, 2012

Experiment 4: Standing waves

Purpose:
The purpose of this experiment is to deeply gain the knowledge and understanding of the standing waves. We will examine the behavior of the standing waves depend on the external force. Moreover, the resonant conditions for standing waves on string will be investigated.

Procedure:
1. Obtain a string and measure its mass and length. m = 2.11 +/- 0.01g and l = 1.5 +/- 0.01 m.
2. Attract one end of the string to the hanging mass of 200g and other end to the table clamp.
3. Attract the wave driver to string approximate 10 cm from the clamp.
4. Set up the function generator to attract the wave driver.
5. Adjust the amplitude of the function generator to 5.00 volts and start adjusting the frequency until the string oscillates in its fundamental mode. Record the frequency, the number of nodes, total length of string.
6. Repeat step 5 for second, third, ... harmonic.

Data:
Harmonic
Frequency (Hz)
# nodes
length (m)
1
18
2
1.1
2
38
3
1.1
3
57
4
1.1
4
71.1
5
1.1
5
79.2
6
1.47
6
95.1
7
1.47
7
111.6
8
1.47


8. Reduce the mass of the hanging mass to 50g.
9. Repeat step 5.

Data:


Harmonic
Frequency (Hz)
# nodes
length (m)
Amplitude
1
8
2
1.47
10
2
16
3
1.47
5
3
23.9
4
1.47
5
4
32.3
5
1.47
5
5
40.8
6
1.47
5

  Analysis Data:
 Lambda λ = 2L/n = 2*1.1/1 = 2.2 m

Case 1: 
lambda λ (m)
2.2
1.1
0.733333
0.55
0.588
0.49
0.42


 The graph of the frequency vs. 1/λ


From the equation (5) : v = sqr (T/mu) = sqr (0.2*9.81 / (2.11*10^-3 / 1.5) = 37.3 m/s

% error = ( v1 - v2)/ (v1 + v2)/2 = (47.977 - 37.3)/(47.977 + 37.3)/ 2 = 6.3%


Case 2:


Lambda λ (m)
2.94
1.47
0.98
0.735
0.588
 The graph of the frequency vs. 1/λ


From equation (5) v = sqr (T/mu) = sqr (0.05*9.8/(2.11*10^-3 / 1.5)) = 18.7 m/s
% error = (v1 - v2)/(v1 + v2)/2 = (24.079 - 18.7 ) / (24.079+18.7)/2 = 6.3 %

Ratio of the wave speeds from the graph: R = v1/v2 = 47.977/24.079 = 2

Ratio of the wave speeds from equation (5) : R = v1/v2 = 37.3/18.7 = 2
From the two ratios, the ratios of wave speeds from two case is the factor of 2.

The measured frequencies for case 1 are most likely equal to n*f_1, where n is the number of harmonic.
The ratio of frequency of the second harmonic for case 1 compared to case 2.
R = f1/f2 = 38/ 16 = 2.38

Ratio for the third, fourth, fifth harmonic.


Harmonic
ratio
3rd
2.38
4th
2.20
5th
2.37

The ratios of the frequency of the third, fourth, fifth harmonic for case 1 and 2 are closed to each other.


Summary:

Based on the purpose of this experiment, the results come out for two cases are reasonable if the sources error are concerned. The % error for the wave speeds are the same for each case which mean there are the same error occur in this experiment. The errors may from  the friction of the pulley, the uncertainty of the mass and length of the string, and the uncertainty of the function generator. In comparison the frequencies for two cases, the ratios come out are very closed to each other. Therefore, we can assume that the ratio of the frequency of the standing wave on string for different tension is a constant. Theoretically, the ratio is equal to the square root of the tension ratio. However, the ratio in this experiment is more that ratio. There are some source errors in this experiment.