The purpose of this experiment is to examine the sound. In this experiment, students will use the sensor to collect the sound data to computer and get the graph of the sound. As soon as students get the graph, students will examine the sound and see if the sound wave have the same characteristics as mechanical wave.
Procedure:
1. Set up the sensor to the computer and the microphone to the sensor.
2. One person in our group say "AAAAAAA" into the microphone and hit Collect.
3. Once we get the graph, we start examining the graph.
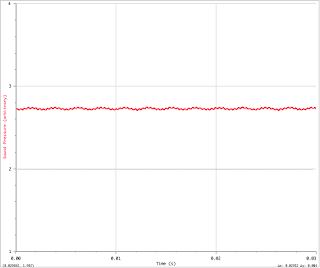
The graph is a periodic wave because it has the shape similar to periodic waves which has the period, the amplitude, the wavelength.
There is only one wave shown in this sample. We determined this number by looking at the maximum amplitude of the sound. The little patterns between two bigger amplitude is the surrounding noise.
For something in our everyday experience such as "Lunch passes by at a snails pace" or "Physics class flies by as fast as a jet by the window", the probe collected data for about 0.04 - 0.05 second.
The period of the wave is T = 0.0209 - 0.0056 = 0.0153 s. We measure the time between 2 maximum amplitude to calculate the period.
The frequency is f = 1/T = 1/ 0.0153 = 65.36 Hz. The frequency is equal to inverse of the period.
The wavelength λ = v/f = 340 / 65.36 = 5.202 m. This length is almost as long as the white board.
The amplitude A = (3.261 - 2.413)/2 = 0.424. This number is determined by taking the average of the maximum and minimum amplitudes.
The graph would be seen bigger especially the little waves between the 2 big amplitudes. Those waves will look like the waves itself. The period would be smaller, so the frequency is higher. The wavelength will become the distance between 2 little amplitudes, so the wavelength is smaller. Also, the amplitude is smaller.
4. Now someone else in the group says "AAAAAA" and collect data.
The 2 patterns are very similar except the amplitude.These two graphs show 4 antinodes in each. As shown, they have very close the number of waves. The period is T = 0,0179 - 0.0044 = 0.0135. The frequency is f = 1/T = 1/0.0135 = 74.07 Hz. Wavelength λ = v/f = 340/74.07 = 4.59 m. Those values are closed to the first person values .The reason is the two persons did the experiment are male which have similar frequency when they speak. However, the amplitude can be seen bigger than the first person. The reason is the second person says "AAAAA" louder than the first person.
5. Now, collect the sound made by the tuning fork.
The sound waves made by the tuning fork is much smother than the sound waves made by human. We can see that the pattern is similar to the sinusoidal waves. The reason which two the waves made by human and the waves made by the tuning fork is different is human cannot keep the same frequency when we say "AAAAA" into the microphone. In addition, the tuning fork vibrates at the same frequency when striking on a soft object.
6. Now strike the tuning fork to a soft object but not as hard as the previous one and collect data.
I expect to see the amplitude is smaller because the sound made by soft strike is less loud than the previous one. Also, the wavelength is smaller because when we strike softer, the force exerts on the tuning force is smaller. As the result, the tuning fork will vibrate less than the previous one.
I strike the tuning fork softer than the previous one to make the sound softer.
The graph shows what I expected is correct. The new waves have smaller amplitude and wavelength.
Summary.
Based on the purpose of this experiment, the sound can be treated similar to the mechanical waves on string or the wave visible waves such as the water waves. If the sound is made by the smooth frequency, the sound waves look like the sinusoidal waves. Moreover, for the same making sound equipment, the sound is proportional to the graph of the sound.


No comments:
Post a Comment